In #182, I presented a benchmark based on 30,000 time series, comparing the sequential split conformal method to the state of the art in Conformal prediction for Forecast.
In this post, I’ll present a benchmark based on 1311 time series from the Tourism competition, comparing the sequential split conformal method to the state of the art. Theta method from the forecast package is used as the base model, along with my R package ahead for conformalizing the base model. 2 target coverage levels are considered: 80% and 95%. The benchmarking errors are measured by:
utils::install.packages(c('foreach', 'forecast', 'fpp', 'fpp2', 'remotes', 'Tcomp'),
                        repos="https://cran.r-project.org")
remotes::install_github("Techtonique/ahead")
remotes::install_github("thierrymoudiki/simulatetimeseries")
remotes::install_github("herbps10/AdaptiveConformal", force=TRUE)
remotes::install_github("thierrymoudiki/misc")

suppressWarnings(library(datasets))
suppressWarnings(library(forecast))
suppressWarnings(library(foreach))
suppressWarnings(library(fpp2))
suppressWarnings(library(ahead))
suppressWarnings(library(AdaptiveConformal))
suppressWarnings(library(misc))
suppressWarnings(library(Tcomp))
coverage_score <- function(obj, actual) {
  if (is.null(obj$lower))
  {
    return(mean((obj$intervals[, 1] <= actual)*(actual <= obj$intervals[, 2]))*100)
  }
  return(mean((obj$lower <= actual)*(actual <= obj$upper))*100)
}

winkler_score <- function(obj, actual, level = 95) {
  alpha <- 1 - level / 100
  lt <- try(obj$lower, silent = TRUE)
  ut <- try(obj$upper, silent = TRUE)
  actual <- as.numeric(actual)
  if (is.null(lt) || is.null(ut))
  {
    lt <- as.numeric(obj$intervals[, 1])
    ut <- as.numeric(obj$intervals[, 2])
  }
  n_points <- length(actual)
  stopifnot((n_points == length(lt)) && (n_points == length(ut)))
  diff_lt <- lt - actual
  diff_bounds <- ut - lt
  diff_ut <- actual - ut
  score <- diff_bounds
  score <- score + (2 / alpha) * (pmax(diff_lt, 0) + pmax(diff_ut, 0))
  return(mean(score))
}

get_error <- function(obj, actual, level = 95)
{
  actual <- as.numeric(actual)
  mean_prediction <- as.numeric(obj$mean)
  me <- mean(mean_prediction - actual)
  rmse <- sqrt(mean((mean_prediction - actual)**2))
  mae <- mean(abs(mean_prediction - actual))
  mpe <- mean(mean_prediction/actual-1)
  mape <- mean(abs(mean_prediction/actual-1))
  coverage <- as.numeric(coverage_score(obj, actual))
  winkler <- winkler_score(obj, actual, level = level)
  res <- c(me, rmse, mae, mpe,
           mape, coverage, winkler)
  names(res) <- c("me", "rmse", "mae", "mpe",
                  "mape", "coverage", "winkler")
  return(res)
}
ahead_methods <- c("block-bootstrap", "surrogate",
                   "kde", "bootstrap")

aci_methods <- c('ACI', 'SCP', 'AgACI',
                 'DtACI', 'SF-OGD', 'SAOCP')

i <- 3
level <- 95
nsim <- 250
ahead_method <- ahead_methods[1]
aci_method <- aci_methods[1]

# base model
obj <- forecast::thetaf(y=Tcomp::tourism[[i]]$x,
                        h=Tcomp::tourism[[i]]$h,
                        level=level)
print(get_error(obj, Tcomp::tourism[[i]]$xx))

# conformalized ahead
obj_ahead <- ahead::conformalize(FUN=forecast::thetaf,
                           y=Tcomp::tourism[[i]]$x,
                           h=Tcomp::tourism[[i]]$h,
                           level=level,
                           nsim = nsim,
                           method=ahead_method)
print(get_error(obj_ahead, Tcomp::tourism[[i]]$xx))

# AdaptiveConformal
(obj_aci <- AdaptiveConformal::aci(Y = as.vector(Tcomp::tourism[[i]]$xx),
                                   predictions = as.vector(obj$mean),
                                   method = "ACI",
                                   alpha = level/100))
obj_aci$mean <- as.vector(obj$mean)
print(get_error(obj_aci, Tcomp::tourism[[i]]$xx))


## -----------------------------------------------------------------------------------
ahead_methods <- c("block-bootstrap", "surrogate",
                   "kde", "bootstrap")

aci_methods <- c('ACI', 'SCP', 'AgACI',
                 'DtACI', 'SF-OGD', 'SAOCP')

n_series <- length(tourism)

for (level in c(80, 95))
{
  pb <- utils::txtProgressBar(min=0, max=n_series, style = 3)
  benchmark <- foreach::foreach(i=1:n_series, .combine = rbind)%do%
  {
    results <- matrix(NA,
                      nrow= 1 + length(ahead_methods) + length(aci_methods),
                      ncol=9)
    colnames(results) <- c("series", "method",
                           "me", "rmse", "mae", "mpe", "mape",
                           "coverage", "winkler")
    results_index <- 1
    # base model
    obj <- forecast::thetaf(y=Tcomp::tourism[[i]]$x,
                            h=Tcomp::tourism[[i]]$h,
                            level=level)
    results[results_index, ] <- c(i, "none",
                                  get_error(obj, Tcomp::tourism[[i]]$xx))
    results_index <- results_index + 1
    # conformalized ahead
    for (j in 1:length(ahead_methods))
    {
      obj_ahead <- try(ahead::conformalize(FUN=forecast::thetaf,
                               y=Tcomp::tourism[[i]]$x,
                               h=Tcomp::tourism[[i]]$h,
                               level=level,
                               nsim = nsim,
                               method=ahead_methods[j]), silent = TRUE)
      if (inherits(obj_ahead, "try-error"))
      {
        results[results_index, ] <- c(i, paste0("conformal-", ahead_methods[j]), rep(NA, 7))
      } else {
       results[results_index, ] <- c(i, paste0("conformal-", ahead_methods[j]),
                                    get_error(obj_ahead, Tcomp::tourism[[i]]$xx))
      }
      results_index <- results_index + 1
    }
    # AdaptiveConformal
    for (j in 1:length(aci_methods))
    {
      obj_aci <- try(AdaptiveConformal::aci(Y = as.vector(Tcomp::tourism[[i]]$xx),
                                         predictions = as.vector(obj$mean),
                                         method = aci_methods[j],
                                         alpha = level/100), silent = TRUE)
      if (inherits(obj_ahead, "try-error"))
      {
        results[results_index, ] <- c(i, paste0("conformal-", aci_methods[j]),
                                      rep(NA, 7))
      } else {
        obj_aci$mean <- as.vector(obj$mean)
        results[results_index, ] <- c(i, paste0("conformal-", aci_methods[j]),
                                    get_error(obj_aci, Tcomp::tourism[[i]]$xx))
      }
      results_index <- results_index + 1
    }

    utils::setTxtProgressBar(pb, i)
    results
  }
  close(pb)

  benchmark <- cbind.data.frame(benchmark[, c(1, 2)],
                                apply(benchmark[, -c(1, 2)], c(1, 2), as.numeric))

  benchmark$method <- sapply(1:length(benchmark$method),
                             function(i) gsub(pattern = "conformal-",
                                              replacement = "",
                               x=benchmark$method[i]))

  saveRDS(benchmark, paste0("2025-01-20-tourism-benchmark", level, ".rds"))
}
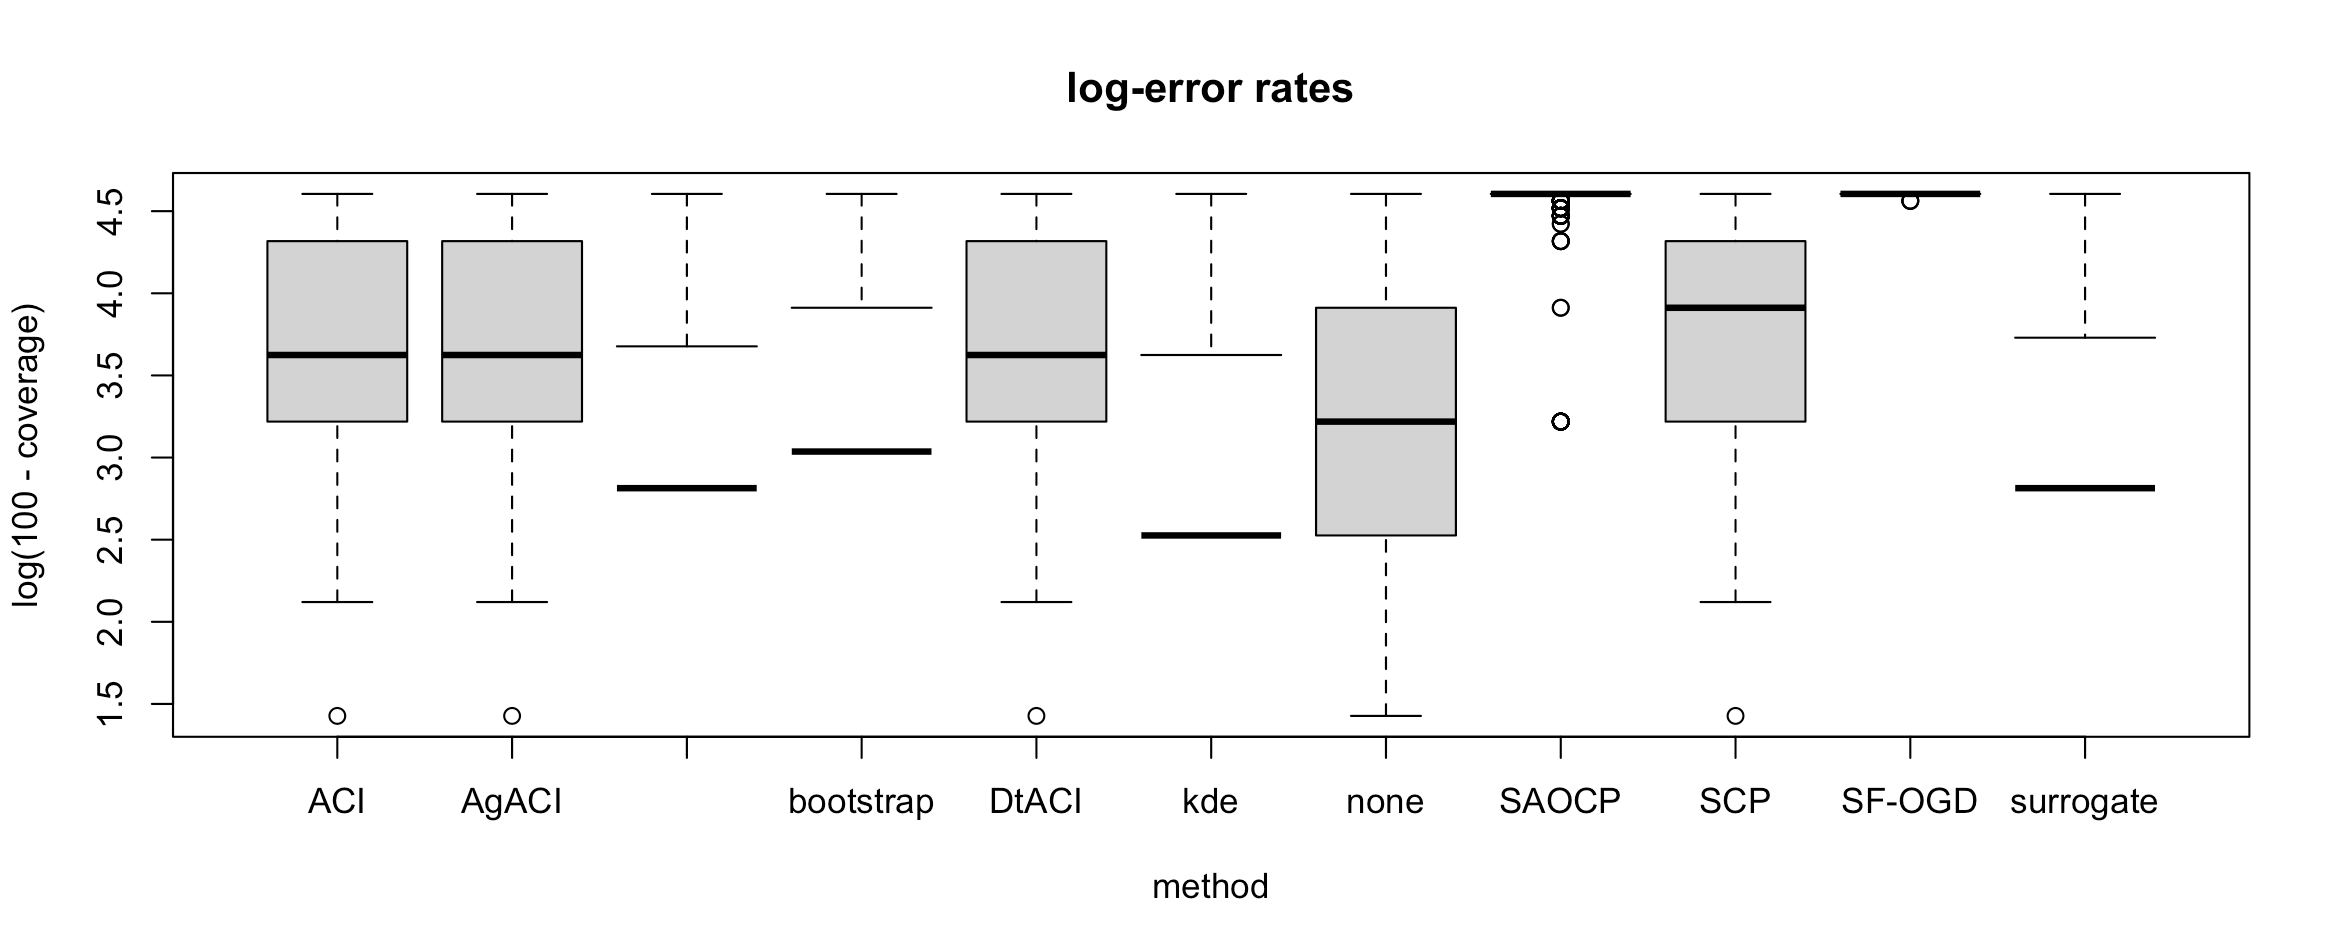
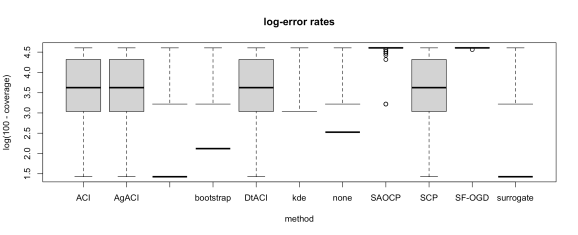
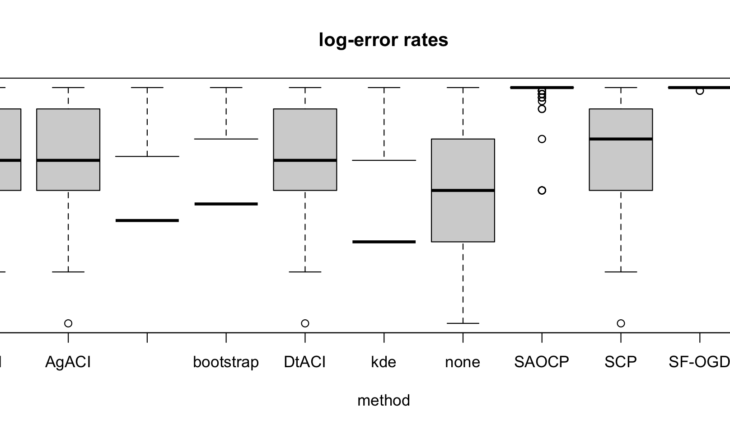
Coverage rates and Winkler scores for the 80% and 95% prediction intervals are presented, along with boxplots of the log-error rates (the lower the better).
tourism_benchmark80 <- readRDS("2025-01-20-tourism-benchmark80.rds")
tourism_benchmark95 <- readRDS("2025-01-20-tourism-benchmark95.rds")

benchmark_medians80 <- cbind.data.frame(tapply(tourism_benchmark80$coverage,
                                             tourism_benchmark80$method, median),
                                    tapply(tourism_benchmark80$winkler,
                                           tourism_benchmark80$method, median))
colnames(benchmark_medians80) <- c("coverage", "winkler_score")
misc::sort_df(benchmark_medians80, by="winkler_score")

benchmark_medians95 <- cbind.data.frame(tapply(tourism_benchmark95$coverage,
                                               tourism_benchmark95$method, median),
                                        tapply(tourism_benchmark95$winkler,
                                               tourism_benchmark95$method, median))
colnames(benchmark_medians95) <- c("coverage", "winkler_score")
misc::sort_df(benchmark_medians95, by="winkler_score")

par(mfrow=c(2, 1))
boxplot(log(100-coverage) ~ method, data = tourism_benchmark80,
        main="log-error rates")
boxplot(log(100-coverage) ~ method, data = tourism_benchmark95,
        main="log-error rates")

                coverage winkler_score
surrogate       83.33333      9339.212
block-bootstrap 83.33333      9372.207
kde             87.50000      9419.847
bootstrap       79.16667     10110.819
none            75.00000     11582.445
AgACI           62.50000     17010.164
DtACI           62.50000     17031.145
ACI             62.50000     17165.020
SCP             50.00000     18008.067
SAOCP            0.00000     47472.648
SF-OGD           0.00000     47535.205

                 coverage winkler_score
surrogate        95.83333      9453.619
block-bootstrap  95.83333      9625.191
kde             100.00000      9705.674
none             87.50000      9845.460
bootstrap        91.66667     10042.757
AgACI            62.50000     16564.417
ACI              62.50000     16649.422
DtACI            62.50000     16649.422
SCP              62.50000     16649.422
SAOCP             0.00000     47472.648
SF-OGD            0.00000     47535.205


So, based on these extensive experiments against the state of the art (and assuming the implementations of the state of the art methods are correct, which I’m sure they are, see https://computo.sfds.asso.fr/published-202407-susmann-adaptive-conformal/, and assuming I’m using them well), how cool is this contribution to the science of forecasting?
Related


