[This article was first published on r.iresmi.net, and kindly contributed to R-bloggers]. (You can report issue about the content on this page here)
Want to share your content on R-bloggers? click here if you have a blog, or here if you don’t.
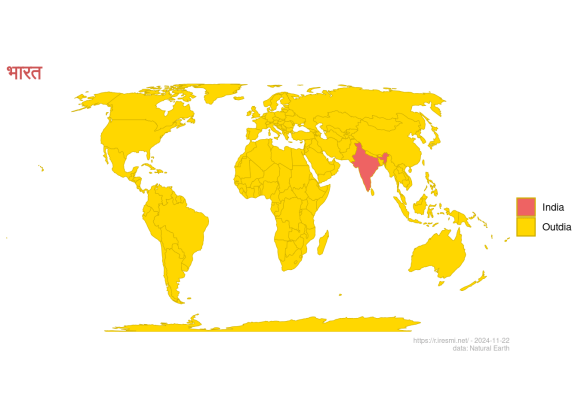
Day 22 of 30DayMapChallenge: « 2 colours » (previously).
Just a joke…
library(dplyr)
library(rnaturalearth)
library(ggplot2)
library(glue)
Data from Natural Earth.
countries <- ne_countries(scale = 110, returnclass = "sf")
countries |>
  ggplot() +
  geom_sf(aes(fill = if_else(sovereignt == "India", sovereignt, "Outdia")),
          color = "gold3") +
  scale_x_continuous(expand = c(0, 0)) +
  scale_y_continuous(expand = c(0, 0)) +
  scale_fill_manual(name = "",
                    values = list("India" = "indianred2",
                                  "Outdia" = "gold1")) +
  coord_sf(crs = "+proj=eqearth") +
  labs(title = "भारत",
       caption = glue("https://r.iresmi.net/ - {Sys.Date()}
                      data: Natural Earth")) +
  theme_void() +
  theme(plot.title = element_text(color = "indianred3",
                                  size = 16,
                                  face = "bold"),
        plot.caption = element_text(size = 6,
                                    color = "darkgrey"),
        plot.margin = unit(c(1, 2, 1, 2), "mm"))


Related


