- Traders increased the likelihood of a massive Bank of Canada rate cut in December.
- Canada’s unemployment rate jumped from 6.5% to 6.8%.
- US job growth surged, with over 200,000 jobs in November.
The USD/CAD weekly forecast suggests further upside for the pair as markets await another massive BoC rate cut.
Ups and downs of USD/CAD
The USD/CAD pair had a bullish week, where the Canadian dollar lost ground against the US dollar. The loonie was weak as traders increased the likelihood of a massive Bank of Canada rate cut in December. At first, this was due to a downbeat GDP report. Moreover, Canada released a mixed employment report on Friday. Markets focused on the unemployment rate, which jumped from 6.5% to 6.8%.
-If you are interested in Islamic forex brokers, check our detailed guide-
Meanwhile, the greenback fared better despite mixed economic figures. Business activity in the US services sector fell. On the other hand, job growth surged, with over 200,000 jobs in November. However, unemployment also increased to 4.2%, solidifying the chance of a December Fed rate cut.
Next week’s key events for USD/CAD


Next week, market participants will focus on US consumer and producer inflation data. Meanwhile, the Bank of Canada will hold its policy meeting on Wednesday. The US inflation figures will shape the outlook for the December Fed meeting.
Last month, inflation increased in line with expectations, indicating a pause in the downtrend. An upbeat report this week will increase the likelihood of a Fed pause in December. On the other hand, a downbeat report will solidify rate-cut bets, weighing on the dollar.
Meanwhile, the Bank of Canada might implement another super-sized rate cut next week. Canada’s economy has significantly slowed, putting pressure on the central bank to cut interest rates. A 50-bps cut will likely weaken the loonie.
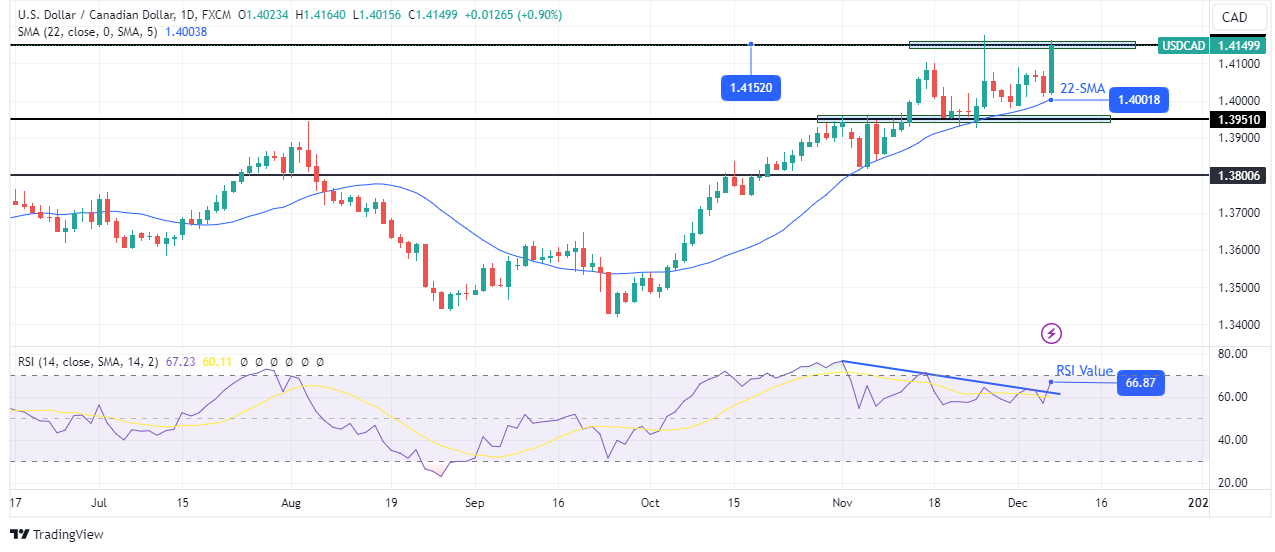
USD/CAD weekly technical forecast: Bulls test 1.4152 resistance


On the technical side, the USD/CAD price made a sharp move from the 22-SMA to the 1.4152 resistance level. As a result, the price has moved well above the SMA, showing bulls are in the lead. At the same time, the RSI, which had initially shown fading momentum, broke above its resistance line and is approaching the overbought region.
-If you are interested in brokers with Nasdaq, check our detailed guide-
However, bulls are still facing a strong hurdle at the 1.4152 level. A break above this level will make a higher high, continuing the bullish trend. On the other hand, if the level holds firm, the price might bounce lower next week to retest the 22-SMA support.
Looking to trade forex now? Invest at eToro!
67% of retail investor accounts lose money when trading CFDs with this provider. You should consider whether you can afford to take the high risk of losing your money.


