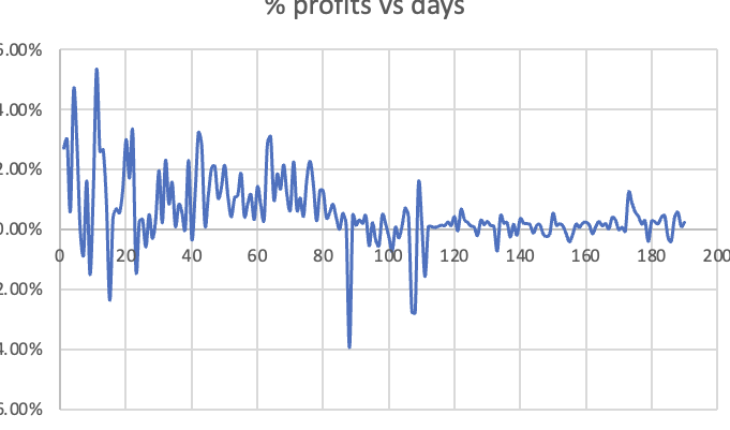
I have been paper day trading since July 2023 and have accumulated some interesting statistics.
Since this is sim, don’t treat it too seriously, more for entertainment and for fun.
Here are some facts: First ~80 trading days the paper trades were done with the Schwab SSE platform. Then I switched over to live trades for 3 months. Switched back to sim in early 2024, first trying out the TOS platform, then continued till today. I don’t day trade every day and # days is not the same as total days the market opened.
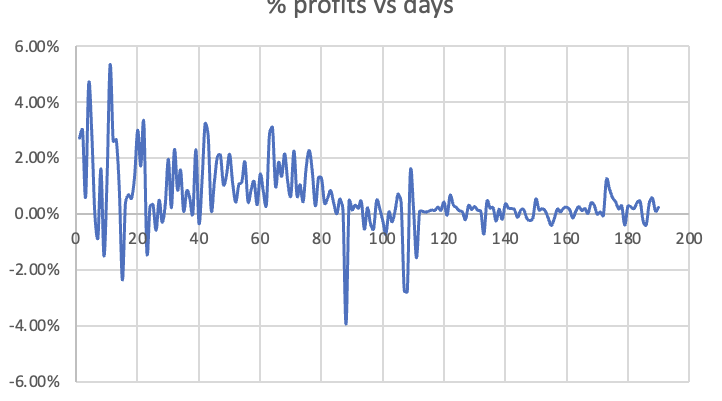
I already showed the average % profit graph in a different thread and here it is for completeness:
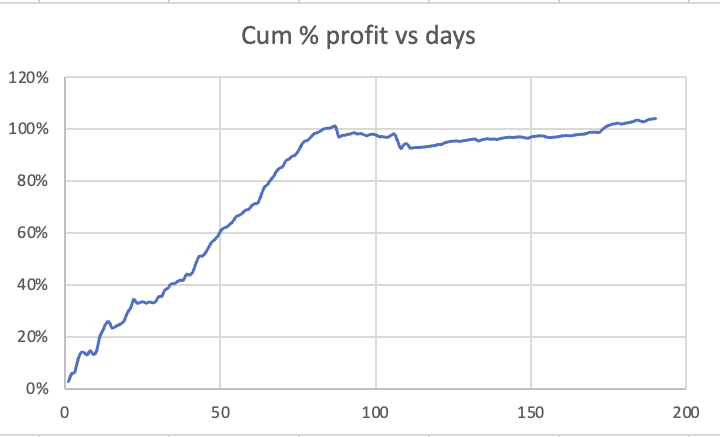
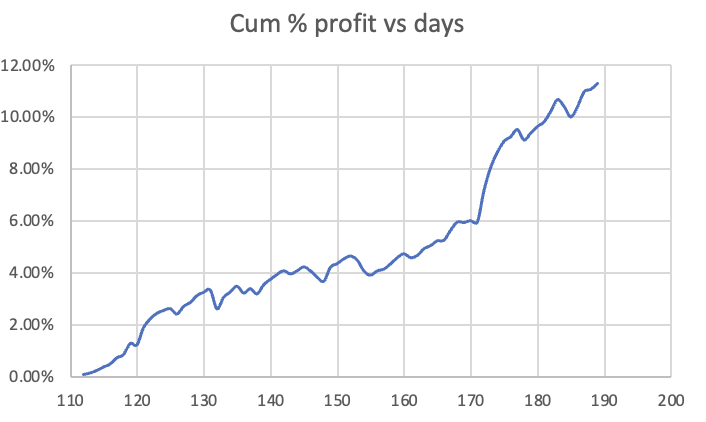
Here is the same data plotted as cum % profits:
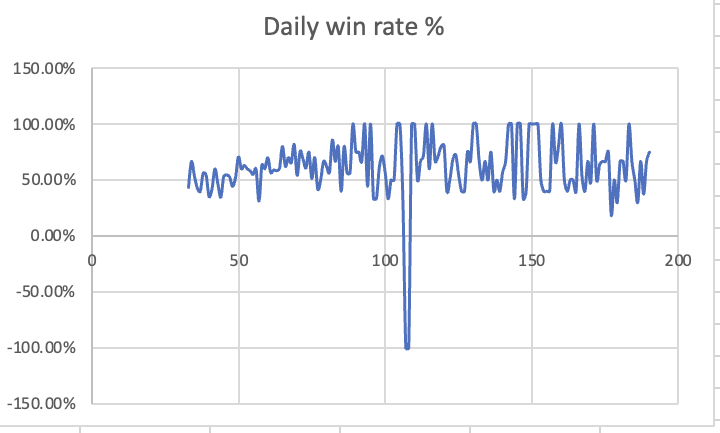
Next is the graph for daily win %. I didn’t collect win rate for the first 30 days and data is unavailable but similar, ~50% win rates.
And finally, the TOS platform’s cum profit % for scalping.
First 80 day’s sim cannot be duplicated because Schwab shutdown SSE in early 2024 and is no longer available so the only reliable data is the TOS results.
The main difference between the first 80 days and the rest, in terms of method is first 80 days I traded BO the rest I scalped.
I posted these as a tribute to @SteveH‘s posts, reposted by @Sekiyo on my other thread for the data confirmed his teachings: high win rate may make me feel good but produces inferior results compared to low win rate and higher R:R.

