

- The AUD/USD price analysis shows a strong performance in Australia’s economy.
- Australia’s economy expanded by 0.6% quarterly.
- Market participants worried about the outlook for the US economy.
The AUD/USD price analysis shows a strong performance in Australia’s economy, easing pressure on the RBA to lower borrowing costs. Meanwhile, there was increased volatility, and the dollar fell as Trump ignited trade wars with new tariffs and threats of more.
–Are you interested in learning more about making money with forex? Check our detailed guide-
Data on Wednesday revealed that Australia’s economy expanded by 0.6% quarterly, well above the previous reading of 0.3%. This is a sign that demand remains strong. As a result, the Australian dollar rebounded from recent lows. Policymakers can relax as inflation slowly drops. However, after years of pausing, the Reserve Bank of Australia implemented its first rate cut in February. The move showed confidence among policymakers that inflation is under control. As a result, market participants expect more rate cuts.
Elsewhere, the dollar eased from the previous session’s peaks as market participants worried about the outlook for the US economy. On Tuesday, Trump implemented a 25% tariff on goods from Canada and Mexico. Moreover, he added a 10% tariff on Chinese goods and promised more tariffs to start in April. These duties have ignited trade wars, with countries vowing to respond appropriately. As a result, the outlook for the global economy has dimmed. The US economy will also suffer.
Meanwhile, market participants are looking forward to US employment data. The report will give more clues on the outlook for Fed rate cuts.
AUD/USD key events today
- ADP Nonfarm employment change
- ISM services PMI
AUD/USD technical price analysis: Double bottom, RSI divergence
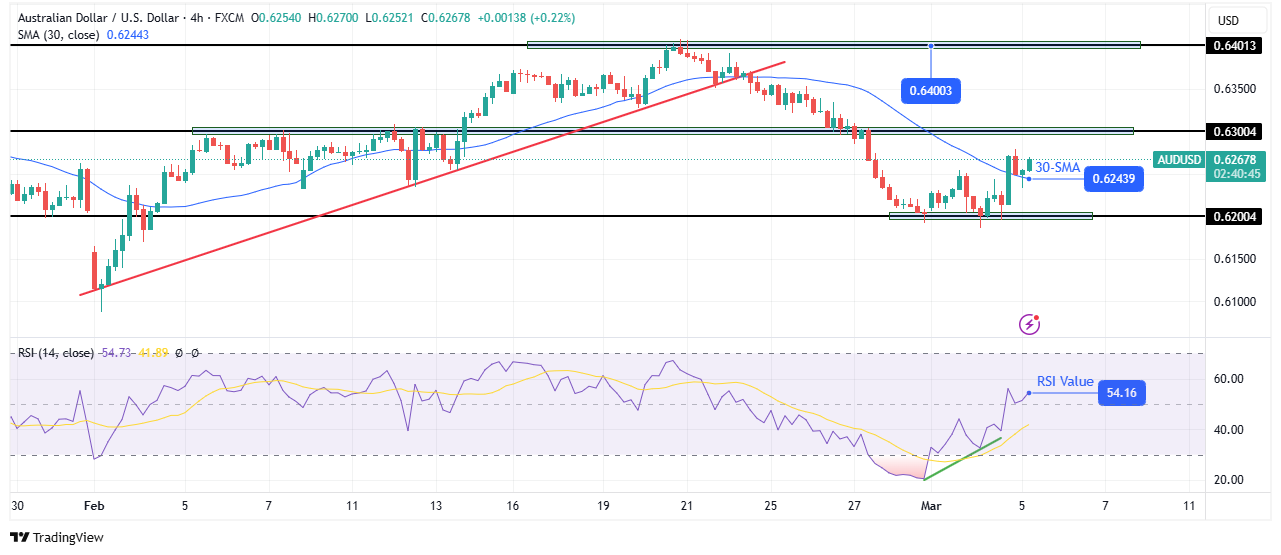
On the technical side, the AUD/USD price has broken above the 30-SMA after reversing at the 0.6200 support level. The price now trades above the 30-SMA with the RSI above 50, suggesting a strong bullish bias.
–Are you interested in learning more about MT5 brokers? Check our detailed guide-
The previous decline halted when AUD/USD reached the 0.6200 support level. Here, the price made a double bottom plus a bullish RSI divergence, indicating weaker momentum. As a result, bulls emerged with a solid candle and broke above the 30-SMA resistance.
However, the price must now face the 0.6300 resistance level. A break above will solidify the bullish bias. On the other hand, if bears return at this level, the price will likely fall below the SMA to retest the 0.6200 support.
Looking to trade forex now? Invest at eToro!
68% of retail investor accounts lose money when trading CFDs with this provider. You should consider whether you can afford to take the high risk of losing your money.


