

- Gold outlook turns bearish as the metal failed to sustain near all-time highs.
- Safe-haven demand for gold returns amid tariffs but faces hurdles due to higher US yields.
- Technically, a short-term correction is possible before gold resumes its upside.
The gold outlook fades its bullish momentum held last week. On Tuesday, the precious metal swiftly fell to a 6-day low at $2,888. Though the prices recovered back above the $2,900 mark, the selling pressure remains unabated.
-Are you looking for the best CFD broker? Check our detailed guide-
The gold found safe-haven demand and surged from the lows as market participants responded to the tariff jitters and geopolitical developments. Weaker US data, including a sharp fall in consumer confidence to the lowest level since Aug 2021, raised concerns about economic growth. Moreover, the trade war fears renewed as Trump ordered a new probe to impose tariffs on copper imports.
Despite the fundamental reasons favoring gold, the rising US yields cap the gains. The 10-year bond yields rose to 4.33% after the US House of Representatives approved Trump’s budget plan, which could smoothen the tax cut path. Higher yields make gold, a non-yielding asset, less attractive to buyers.
Market participants now see speeches from Fed officials that could provide further guidance on the monetary policy. A hawkish stance could further pressure the gold.
Additionally, the US Q4 GDP and US Core PCE Index remain the limelight events of the week that could drive the trend in gold prices.
Gold Price Technical Outlook: Bears aiming for $2,850
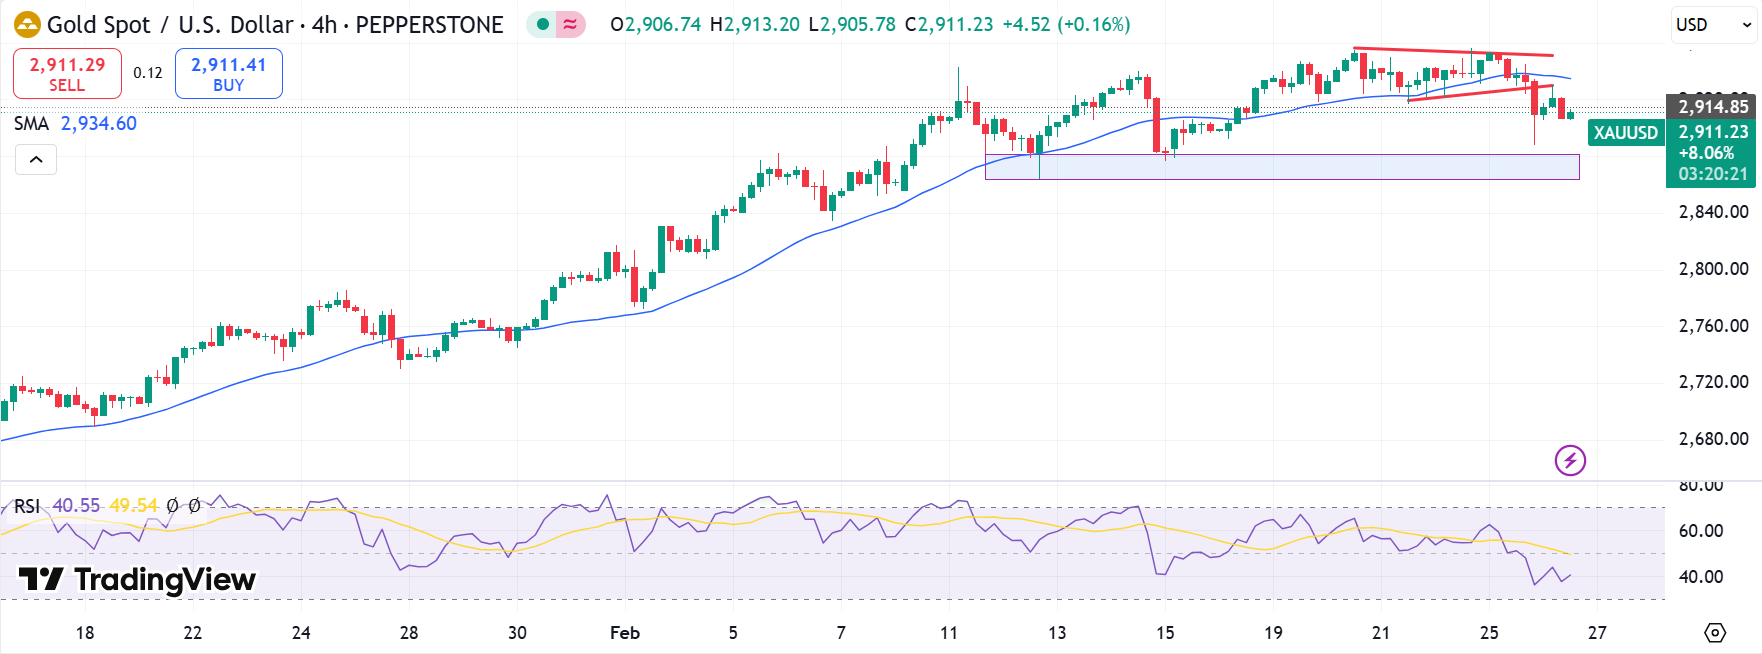
From a technical perspective, the gold’s breakout of pennant below $2,900 suggests a short-term weakness. The price is currently well above the key demand zone above $2,850. However, testing and breaking the zone could accelerate the selling towards $2,800 ahead of $2,750.
–Are you interested to learn more about day trading brokers? Check our detailed guide-
The 4-hour chart shows the price falls below the 30-period SMA, indicating a premature bearish trend. The 14-period RSI is around 40.0, another indicator of bearish gold.
At the time of writing, the prices consolidate around $2,910, lacking a directional bias. Any upside breakout could lead to $2,935 ahead of the all-time high at $2,956, while the ultimate target for the buyers remains at the $3,000 psychological mark.
Looking to trade forex now? Invest at eToro!
67% of retail investor accounts lose money when trading CFDs with this provider. You should consider whether you can afford to take the high risk of losing your money.


