

- The GBP/USD forecast turns neutral after falling from a 10-week top.
- Tariff jitters, US inflation, and BoE’s dovishness, could ignite selling pressure.
- US Core PCE and US GDP are key events to watch.
The GBP/USD forecast remains neutral as the price retreated after hitting a 10-week top at 1.2690 on Monday. The price wobbles around 1.2630 at the time of writing.
The pullback came as investors assessed the inflation risk in the US after last week’s higher CPI reading. The recent development has dampened the Fed’s expected two rate cuts in 2025. Market participants eye US GDP and US Core PCE Index data this week.
-Are you looking for the best CFD broker? Check our detailed guide-
On the tariffs front, the markets have been hit by a new wave of risk aversion as US President Trump moves forward with his aggressive trade policies. The pound saw volatility due to unsettled global markets.
Across the Atlantic, some key speeches from BoE members are due this week, including Huw Pill, Chief Economist, to speak on Tuesday, followed by Swati Dhingra and Dave Ramsden on Wednesday and Friday, respectively. Traders are cautious as these policymakers could signal a dovish move by the bank.
Meanwhile, the pound’s rally could be limited due to the looming UK’s Spring Budget. Chancellor Rachel Reeves may cut government spending to reduce taxes. This move could signal a weaker economy and weigh on the pound. Given the inflationary pressure, the Bank of England is expected to cut twice in 2025. However, the pace could be gradual.
On the economic front, the US data does not give a clear picture due to mixed data. Traders eye Fed officials’ speeches and US Consumer Confidence data.
GBP/USD Technical Forecast: Wobbling around 30-SMA
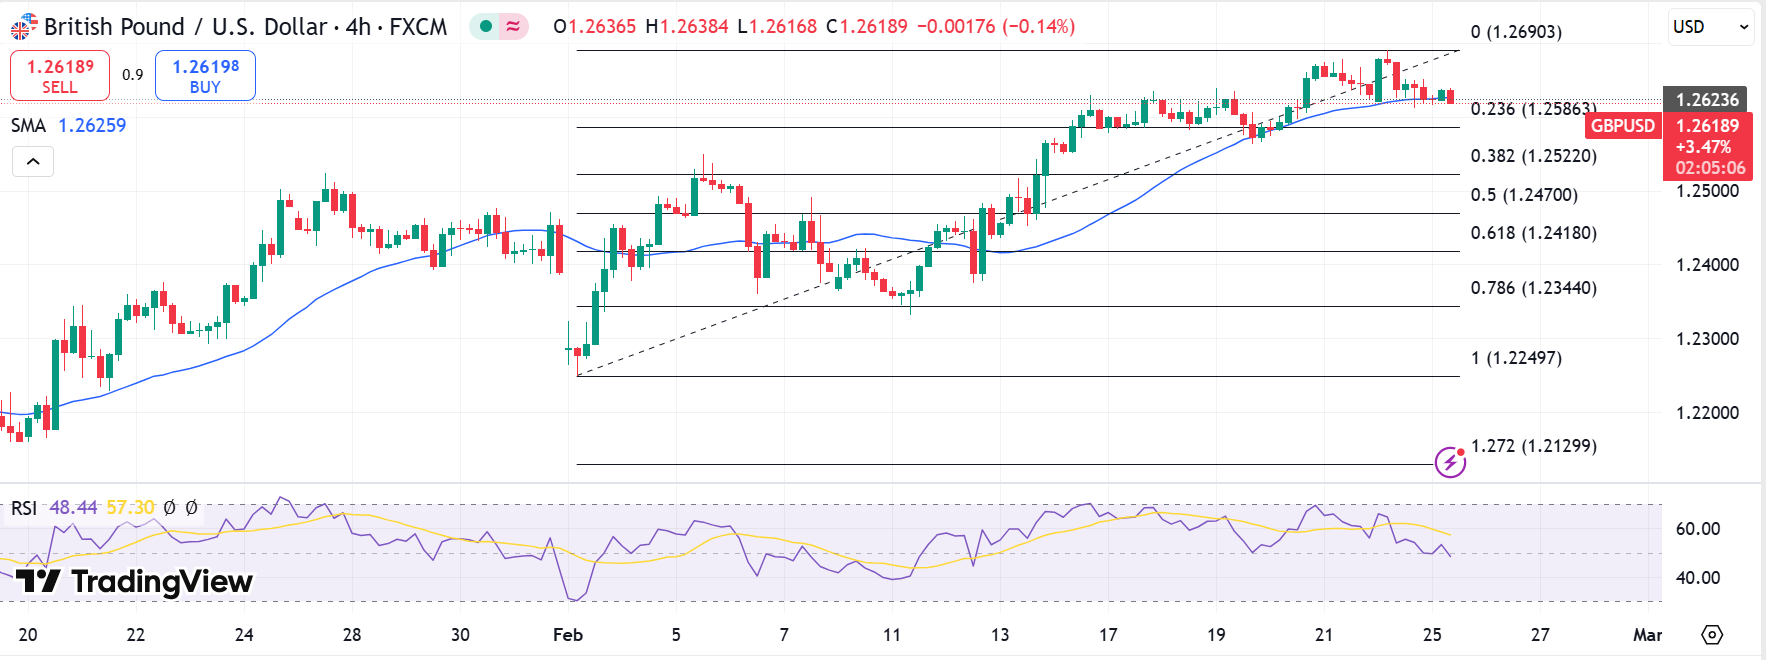
The GBP/USD price wobbles around the 30-period SMA on the 4-hour chart. The neutral outlook gives no clear signal. However, the odds of moving downwards are high as the top formation under a key level of 1.2700 marks intense selling pressure. The immediate support comes at 1.2586, a 23.6 Fib level ahead of 19th Feb lows at 1.2562. Ultimate support emerges at 50.0 Fib level at 1.2470. The RSI value is at 50.0, which also indicates a neutral stance. A downside breakout has a higher potential as the RSI slopes southward.
–Are you interested to learn more about day trading brokers? Check our detailed guide-
On the flip side, finding acceptance above 1.2650 may gather buying traction and revisit 1.2690 ahead of 1.2730. However, the markets need a stimulus to crack the upside.
Looking to trade forex now? Invest at eToro!
67% of retail investor accounts lose money when trading CFDs with this provider. You should consider whether you can afford to take the high risk of losing your money.


