

- Japan released data showing solid wage growth.
- A pause in US tariffs weakened the greenback.
- US employment figures revealed a drop in job growth and lower unemployment.
The USD/JPY weekly forecast is bearish amid increasing bets for a Bank of Japan rate hike, boosting the yen.
Ups and downs of USD/JPY
The USD/JPY pair ended the week lower as the yen rallied against the dollar due to a surge in BoJ rate hike expectations. At the same time, a pause in US tariffs weakened the greenback.
–Are you interested in learning more about STP brokers? Check our detailed guide-
BoJ rate hike bets rose after Japan released data showing solid wage growth.
Meanwhile, the dollar eased as market participants became more convinced that Trump’s tariffs were just a negotiation tactic. He paused tariffs on Canada and Mexico, plunging the dollar. Additionally, employment figures revealed a drop in job growth and lower unemployment, painting a mixed picture of the labor sector.
Next week’s key events for USD/JPY
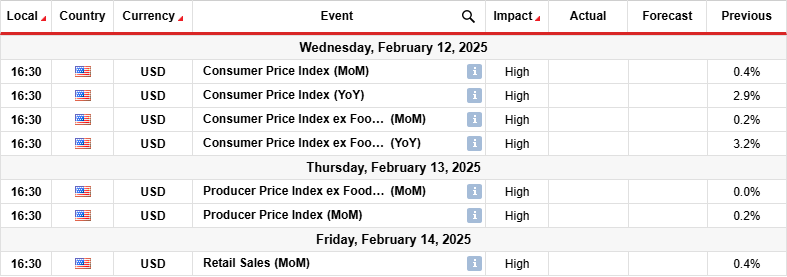
Next week, traders will focus on data from the US, including consumer inflation, producer inflation and retail sales. The inflation figures will show the state of price pressures, shaping the outlook for Fed rate cuts.
Last month, inflation came in at 2.9%, nearing the Fed’s 2% target. However, policymakers have remained cautious because it has paused near this level. As a result, the central bank has been waiting for more progress before signaling further rate cuts. Meanwhile, the retail sales report will show the state of consumer spending in the US.
USD/JPY weekly technical forecast: Price targets the 150.06 support

On the technical side, the USD/JPY price is approaching the 150.06 support level after breaking below its bullish trendline. The price trades far below the 22-SMA, showing a strong lead for bears. At the same time, the RSI trades near the oversold region, indicating solid bearish momentum.
–Are you interested in learning more about making money with forex? Check our detailed guide-
Bulls paused the previous move when the price got to the 158.54 resistance level. Moreover, although the price made higher highs and lows, it broke below the 22-SMA, indicating a corrective move. At the same time, the RSI failed to enter the overbought region, a sign that either bulls were holding back, or bears were strong too.
After the corrective move, USD/JPY might make an impulsive leg. Therefore, the price might break below the 150.06 support to reach the 145.00 support. However, the price might retest the 22-SMA as resistance before continuing lower.
Looking to trade forex now? Invest at eToro!
68% of retail investor accounts lose money when trading CFDs with this provider. You should consider whether you can afford to take the high risk of losing your money.


