Want to share your content on R-bloggers? click here if you have a blog, or here if you don’t.
Time since MƒA
In one of my last posts 2 years ago, I mentioned that I would be looking for work and leaving MƒA. I ended up doubling down on my research background and becoming a part of EL Education’s Research Team, where I have taken an improvement science perspective on the many different programs that they offer schools and districts in line with their vision for a more full definition of student achievement where you don’t measure a student merely on test scores, but on the measure of their work and their character.
My work at EL Education
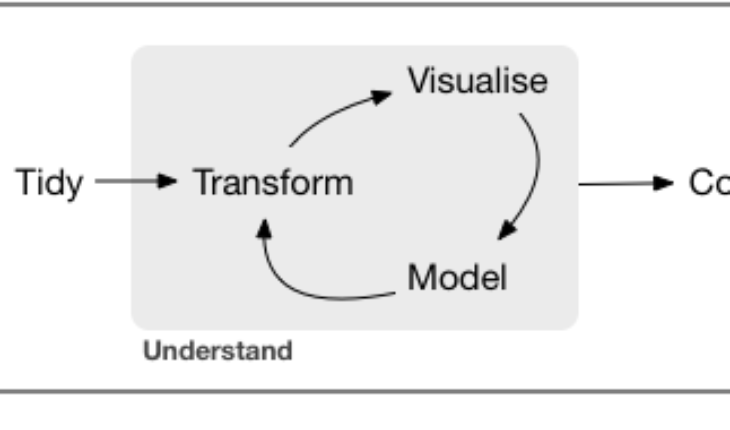
Much of that work has been about positioning EL Education around a data infrastructure that allows them to understand their partners and the impact of their work. This has involved projects that mirror many parts of the data science cycle:


-
Importing Data from disparate sources, including federal databases such as NCES, state systems that hold accountability data, our own data within Salesforce, and the data our partners hold
-
Tidying Data, which involves not only making the data more rectangular, but also making sure that there is a common language of identifiers such that the data can be easily merged and used as filters for each other through inclusive and filtering joins
-
Analyzing the Data, which involves everything from the design of additional instruments to give a qualitative bent to the quantitative data, doing explanatory work to see how different subgroups of students and schools compare, doing modeling work to see how those comparisons relate to each other, and further to understand the story we wish to tell
-
Communication, which has involved dashboards, paramaterized reports, presentations, and other forms of data visualization. This work has gotten extensive enough to merit creating an EL Education Data Visualization guide to make sure that everyone doing this work is on the same page.
This work has been completely done in R and a combination of R Markdown (before) and Quarto (now). My expertise has grown, which has merited taking a look at my old blog, which was done primarily in Markdown, and redoing it in Quarto. This way, I can house the code for the work I’m doing and the explanation within one document, as I do in my work at EL Education.
I hope to use this blog to talk through and showcase some of that work.
Citation
BibTeX citation:
@online{russell2024,
  author = {Russell, John},
  title = {Getting Back into Blogging},
  date = {2024-12-28},
  url = {https://drjohnrussell.github.io/posts/2024-12-28-getting-back-online/},
  langid = {en}
}
For attribution, please cite this work as:
28, 2024. https://drjohnrussell.github.io/posts/2024-12-28-getting-back-online/.
Related


